
@arimi.ai · دليل الريل
من أي تقرير إلى داشبورد تفاعلي
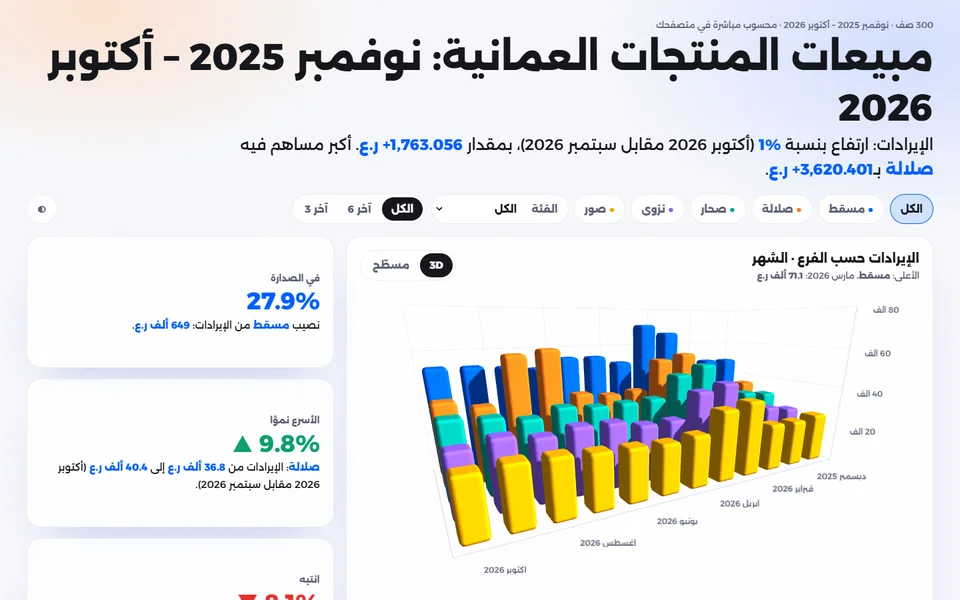
هذا البرومبت الكامل من ريل «داشبورد من أي إكسل». تعطي الذكاء الاصطناعي ملفك، ويعبّي قالب HTML جاهز فيه رسوم ثلاثية الأبعاد وفلاتر وبطاقات للأرقام. تحت تلقى الخطوات، ونسخة النص كاملة للاستخدام.
29 أكتوبر 2026 · الصور من تجربة على بيانات تجريبية، وليست أرقام عمل حقيقية. واجهات الأدوات وحدود الملفات تختلف حسب حسابك وخطتك.
النتيجة اللي بنوصل لها
الخطوات بالترتيب
جهّز ملفك
استخدم ملف Excel أو CSV واضح: صف للعناوين، وبعده البيانات. إذا كان تقريرك PDF أو Word، اختار الجدول الأساسي. جرّب أولاً نسخة فيها بيانات تجريبية، واحذف أسماء العملاء وأرقام الاتصال وأي معلومات خاصة قبل رفعها.
نزّل البرومبت كامل
من زر «تحميل البرومبت TXT». النص فيه التعليمات والقالب مع بعض؛ انسخه بالكامل ولا تختصر الجزء الأخير. القالب هو اللي يرسم الداشبورد ويحسب الأرقام في المتصفح.
أرفق الملف والصق البرومبت
افتح أداة ذكاء اصطناعي تدعم قراءة ملفك وإرجاع ملف HTML، مثل ChatGPT أو Gemini أو Claude، حسب الإمكانات المتاحة لحسابك. أرفق التقرير ثم الصق البرومبت. إذا ما تقدر ترفق، الصق جدولك في قسم YOUR DATA بدلاً من السطر المخصص له.
حدّد ما تبي، أو خلّه يختار
في YOUR NOTES تقدر تكتب العنوان واللون واللغة وأهم رقم يهمّك. الخانات اختيارية. اللغة تتبع بياناتك، والثيم فاتح افتراضياً. مثال: Language: Arabic، والعنوان «مبيعات الفروع».
احفظ النتيجة وافتحها
اطلب الملف كاملاً باسم dashboard.html، ثم نزّله وافتحه في المتصفح. إذا أعطاك كوداً فقط، احفظه كنص بامتداد .html، مع التأكد أن الاسم ما ينتهي بـ .txt. يحتاج إنترنت لتحميل مكتبات الرسوم والخطوط.
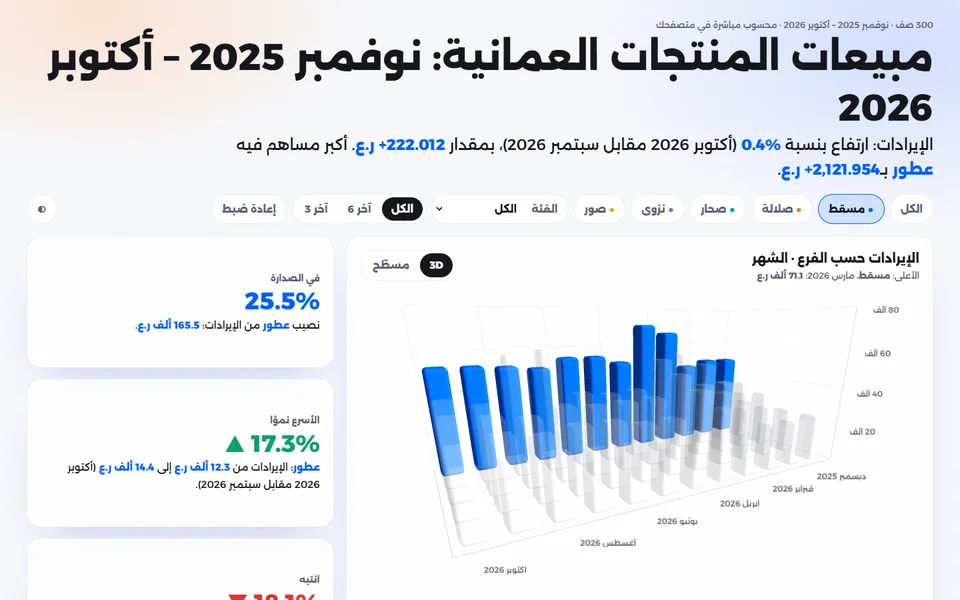
جرّب الفلاتر وراجع الأرقام
اضغط على فرع، أو اختار فئة، وبدّل الفترة الزمنية. المفروض تتغيّر الرسوم والبطاقات معها. قارن إجمالي الإيرادات ورقمين أو ثلاثة من النتائج بملفك الأصلي قبل مشاركة الداشبورد؛ راجع الصفوف المكررة وصفوف الإجمالي إذا ظهر فرق.
البرومبت كامل
النص التالي هو النسخة نفسها في ملف TXT، بما فيها القالب. أسهل طريقة: نزّل الملف وانسخ كل محتواه. النص بالإنجليزية لأن التعليمات والقالب مشتركان بين الأدوات، والنتيجة تدعم العربية.
عرض البرومبت الكامل والقالب
=== YOUR DATA ===
Attach your file (Excel, CSV, PDF or Word report), or paste your table between the two lines.
----------
[paste your table here, or leave this line if you attached a file]
----------
=== YOUR NOTES (optional; leave empty and the AI decides) ===
Title:
Brand colour (hex, e.g. #0F766E):
Theme (light or dark):
Language:
What matters most:
=== INSTRUCTIONS FOR THE AI ===
Turn the data above into ONE HTML dashboard. The design and code are finished: the TEMPLATE at the end. Do not design or write code. Only fill its two JSON blocks, META and DATA, and send back the whole template. The template computes every total, share, change and sentence itself: never calculate a number, only copy the data.
STEP 1. Understand the data (silently)
1. If you can run code, use it to read the file and write DATA.
2. PDF/Word report: use its main table of figures; if figures are only in sentences, build a small table (Section, Item, Value) from figures that really appear.
3. Several sheets: use the main detailed one. Sheets with the same columns (one per month or branch): stack them, adding a column with the sheet name.
4. Months or years as column headers: unpivot to one row per item and period.
5. Remove total, subtotal and average rows and columns, empty rows, notes and repeated headers. A total row would count twice.
6. Keep only columns of these types: "date" (dates, months, quarters, years), "cat" (text with a few repeated values: region, product, status), "num" (numbers to add or average). A code (ID, phone, a year used as a label) is "cat", never "num". Leave out IDs, names and free text.
7. Language: that of the data, unless the notes name one.
STEP 2. META. Example (yours will differ):
{"lang":"en","theme":"light","accent":"","title":"Coffee Sales 2025–26","source":"sales.xlsx","date":"Month","dateLabel":"Month","grain":"month",
"dims":[{"col":"Region","label":"Region"},{"col":"Product","label":"Product"}],
"measures":[
{"col":"Revenue","label":"Revenue","agg":"sum","fmt":"money","unit":"$"},
{"col":"Profit","label":"Profit","agg":"sum","fmt":"money","unit":"$"},
{"col":"Margin","label":"Margin","agg":"ratio","num":"Profit","den":"Revenue","fmt":"pct"},
{"col":"Rating","label":"Rating","agg":"avg","w":"Units","digits":2,"unit":"/5"},
{"col":"Returns","label":"Returns","agg":"sum","unit":"returns","good":"down"}],
"derived":[{"col":"Profit","op":"-","a":"Revenue","b":"Cost"}],
"rows":240,"note":"","notes":["Profit = Revenue − Cost."],"t":{}}
1. lang: "en", "ar"... theme: "light" unless the notes say dark. accent: the notes' colour as "#RRGGBB", else "".
2. title: short and specific, no calculated number. source: file name or "".
3. date: exact name of the date column (it drives the trend and the period chips), or "". dateLabel: its screen name. grain: "month" (also quarters), "year", or "day" (daily data under 3 months).
4. dims: 1 or 2 "cat" columns, best first. The first (3 to 8 values) gives the filter chips and the bars of the 3D/flat chart; the second, a drop-down filter. [] if none.
5. measures: 2 to 6, most important first; they become the KPI cards in this order and the first drives the headline. col = exact column name, label = short screen name.
agg "sum": money, quantities, hours. "avg": ratings, scores, prices, balances, percentages per row; add "w" = a volume column (units, orders) if one exists. "ratio": "num" ÷ "den" (margin = profit / revenue). "count": counts rows, only if nothing can be added up. For ratio and count, col is a new name.
fmt "money" with unit = the currency sign as written ("$", "ر.ع", "SAR"). fmt "pct" only for ratios that are fractions. Every other measure gets a short unit in the dashboard's language ("units", «وحدة», "/5"; "%" if values are already percentages like 42.5). "good":"down" when lower is better (cost, returns, delays).
6. derived: columns made from two "num" columns, op + - * /. If revenue and cost exist, add Profit here and Profit + Margin in measures, as in the example. Else [].
7. rows: exact number of row lines in DATA. note: "" unless Step 3 rule 6 applies. notes: 1 to 3 short assumptions (sheet used, rows removed), no calculated number.
8. t: {} (English and Arabic words are built in; "ar" turns the page right-to-left by itself). Write title, labels and notes in the dashboard's language.
STEP 3. DATA. Example:
{"cols":["Month","Region","Product","Units","Revenue","Cost","Rating","Returns"],
"types":["date","cat","cat","num","num","num","num","num"],
"lookups":{"Month":["2025-11","2025-12"],"Region":["North","South"],"Product":["Beans","Cold Brew"]},
"rows":[
[0,0,0,1236,21613.95,9270,4.2,8],
[1,1,1,1004,18286.5,7530,4.8,5]
]}
1. Keys in this order. cols: exact names. types: one per column.
2. Every "date" and "cat" column is in lookups (each value once, in order of appearance); rows hold its position (0 = first).
3. Lookup dates are ISO: "2025-11", "2025-11-03", "2025"; a quarter is its first month ("Q2 2025" → "2025-04"). Convert "Nov 2025", «نوفمبر 2025», "11/2025", Excel serials.
4. Numbers: plain JSON, Western digits, no separators, signs, % or quotes; (12) is -12; empty is null. Copy every number with ALL its decimals, never round: the page shows a grand total the user checks against their file.
5. ONE row per line, as many values as cols. Copy every row: never invent, sample or skip, never write "...".
6. Size limit: rows × columns ≤ 3,000. If larger: a. drop columns META does not use; b. if you can run code, aggregate with code to one row per period and dims: sum the "sum" columns, add a num column "Rows" (original row count; "count" becomes a sum of Rows), keep group averages for "avg" with w = its weight column or "Rows"; note "Aggregated from N rows"; c. otherwise keep the latest rows that fit; note "Latest X of N rows". Never aggregate in your head.
STEP 4. Reply with exactly:
1. One short line on what you found, in the dashboard's language.
2. The complete file in ONE html code block (or your canvas), <!DOCTYPE html> to </html>.
3. One line: save it as dashboard.html and double-click it (needs internet).
Copy the template exactly: change, reformat, shorten or add nothing; keep escapes like \u2066, \u2069 and \xA0, and every invisible character inside quotes, exactly as written. It is about 18,600 characters and must arrive whole: if space is short, shrink DATA (Step 3 rule 6), never the template or the decimals. DATA is last so a cut-off reply still opens.
SELF-CHECK: 1. Outside META and DATA, the template is complete to </html>, no "...". 2. Valid JSON: double quotes, no comments, trailing commas or NaN. 3. Every name in META (date, dims, col, num, den, w, a, b) matches DATA.cols or a derived col exactly. 4. dims are "cat"; each row has one value per column; lookup positions exist; no total rows; the user's data, not the example. 5. META.rows = row lines in DATA. 6. The <style> block is unchanged: :root still holds every token (--fd, --fb, --bg, --gl, --ln, --hi, --gr, --ink, --mut, --fa, --up, --dn, --sh, --gw).
TEMPLATE. Replace only the lines PUT_META_JSON_HERE and PUT_DATA_JSON_HERE.
```html
<!DOCTYPE html>
<html>
<meta charset="utf-8">
<meta name="viewport" content="width=device-width,initial-scale=1">
<link rel=stylesheet href="https://fonts.googleapis.com/css2?family=Alexandria:wght@500;800&family=Fraunces:wght@600;700&family=Manrope:wght@500;800&display=swap">
<script src="https://cdnjs.cloudflare.com/ajax/libs/echarts/5.6.0/echarts.min.js"></script>
<script src="https://cdnjs.cloudflare.com/ajax/libs/echarts-gl/2.0.8/echarts-gl.min.js"></script>
<script type="application/json" id="META">
PUT_META_JSON_HERE
</script>
<style>
:root{--fd:Fraunces,serif;--fb:Manrope,sans-serif;--bg:#F6F7FB;--gl:#FFFD;--ln:#1E3C8C17;--hi:#FFF;--gr:#1E3C8C0F;--ink:#15171C;--mut:#5B6275;--fa:#DCE1EC;--up:#0E9F6E;--dn:#E5322D;--sh:#2850C84D;--gw:radial-gradient(40% 36% at 10% 2%,#FFC79A73,#0000 70%),radial-gradient(46% 42% at 94% 8%,#B4C8FF8C,#0000 70%)}
[data-theme=dark]{--bg:#07090D;--gl:#141820AD;--ln:#FFFFFF17;--hi:#FFFFFF21;--gr:#FFFFFF0F;--ink:#F3EFE7;--mut:#A39E95;--fa:#3B414D;--up:#3DD6C6;--dn:#FF7A66;--sh:#000B;--gw:radial-gradient(40% 36% at 15% 6%,#F5B54430,#0000 70%)}
[dir=rtl]{--fd:Alexandria,sans-serif;--fb:var(--fd,serif);line-height:1.7}[dir=rtl] *{letter-spacing:0!important}
*{box-sizing:border-box;margin:0}[hidden],#ins:empty{display:none!important}
html{background:var(--gw,#0000),var(--bg,#F6F7FB);background-attachment:fixed;color:var(--ink,#15171C);font:15px/1.5 var(--fb,sans-serif)}
button,select{font:inherit;color:inherit;cursor:pointer}main{max-width:1440px;margin:auto;padding:26px clamp(14px,3vw,40px);display:grid;gap:18px}
main>*,.card{animation:in .8s both}@keyframes in{from{opacity:0;translate:0 22px}}
#ey,.cap,small,.k p,footer,#lg{font-size:13px;color:var(--mut,#5B6275)}#ey b,.ic small{letter-spacing:.14em;text-transform:uppercase;margin-inline-end:9px}
h1{font:700 clamp(32px,4vw,56px)/1.35 var(--fd,serif)}#ld{font:500 clamp(17px,1.6vw,23px)/1.6 var(--fd,serif);max-width:68ch}
#ld b,.ic p b{color:var(--c1,#005EFF)}nav,.r,.hd,#lg{display:flex;flex-wrap:wrap;gap:8px}.r{gap:18px}.r>*{flex:1 1 300px;min-width:0}#hC,#tC{flex:2 1 560px}
.ch,.sg{border:1px solid var(--ln,#1E3C8C17);background:var(--gl,#FFFD);border-radius:99px;padding:8px 15px;font-weight:800;color:var(--mut,#5B6275)}
[aria-pressed=true]{color:var(--ink,#15171C);border-color:var(--c1,#005EFF);background:color-mix(in srgb,var(--c1,#005EFF) 18%,var(--gl,#FFFD))}#th{margin-inline-start:auto}
.sg{display:inline-flex;padding:4px;gap:2px}.sg button{border:0;background:0;border-radius:99px;padding:5px 14px;font-weight:800}.sg [aria-pressed=true]{background:var(--ink,#15171C);color:var(--bg,#F6F7FB)}
.sl{display:inline-flex;align-items:center;gap:8px;padding:4px;padding-inline-start:15px}.sl select{border:0;border-radius:99px;padding:4px 10px;background:var(--hi,#FFF);color:var(--ink,#15171C);max-width:170px}
.card{padding:20px;border-radius:22px;background:var(--gl,#FFFD);border:1px solid var(--ln,#1E3C8C17);box-shadow:inset 0 1px var(--hi,#FFF),0 34px 70px -34px var(--sh,#2850C84D);backdrop-filter:blur(18px);text-align:start;overflow:hidden}
#kp,#ins{display:grid;grid-template-columns:repeat(auto-fit,minmax(var(--m,160px),1fr));gap:16px}#ins{--m:230px}
.k{padding:16px 18px 0}small{display:block;font-weight:800}.k>b{display:block;font:800 30px/1.3 var(--fb,sans-serif);white-space:nowrap}.k i{font-style:normal;font-size:.5em;color:var(--mut,#5B6275)}
.k svg{display:block;width:calc(100% + 36px);height:42px;margin:8px -18px 0}.up{color:var(--up,#0E9F6E)}.dn{color:var(--dn,#E5322D)}
h2{font:700 18px/1.5 var(--fd,serif)}#tr{height:300px}#g3,#g2{height:clamp(270px,40vw,540px)}.hd{justify-content:space-between;align-items:flex-start}
#lg{justify-content:center;gap:4px 16px}#lg button{border:0;background:0;font-weight:800}#hn{text-align:center;font-size:12px}#hn::first-letter{text-transform:uppercase}
.ic strong{display:block;font:700 36px/1.3 var(--fd,serif);color:var(--c1,#005EFF)}.note{padding:14px;border:1px dashed;color:var(--dn,#E5322D);border-radius:14px}
.rb{display:flex;justify-content:space-between;width:100%;margin-top:9px;padding:10px 12px;border:0;border-radius:10px;background:linear-gradient(90deg,#0000,var(--c)) 0/var(--w) no-repeat,var(--gr,#1E3C8C0F)}[dir=rtl] .rb{background-position:100%}
</style>
<main id=mn><header><p id=ey></p><h1 id=ti></h1><p id=ld></p></header><nav id=bar></nav><div class=r><section class=card id=hC><div class=hd><div><h2 id=hT></h2><p class=cap id=hS></p></div><span class=sg id=mo></span></div><div id=g3></div><div id=g2 hidden></div><div id=lg></div><p class=cap id=hn></p></section><aside id=ins></aside></div><div id=kp></div>
<div class=r><article class=card id=tC><h2 id=tT></h2><p class=cap id=tS></p><div id=tr></div></article><article class=card id=rC></article></div><footer id=ft></footer></main>
<script>
const $=i=>document.getElementById(i),H=document.documentElement;let META={};try{META=JSON.parse($('META').textContent)}catch(e){}
H.lang=META.lang||'en';H.dir=/^(ar|fa|ur|he)/.test(H.lang)?'rtl':'ltr';H.dataset.theme=META.theme=='dark'?'dark':'light';
const R=H.dir=='rtl',LC=H.lang.slice(0,2)+'-u-nu-latn',Q=(i,v)=>$(i).innerHTML=v,Z=(a,i=0)=>a[a.length-1-i],ab=Math.abs,F='maximumFractionDigits',mx=Math.max,mn=Math.min,
W=(R?'الكل|نقطة|{m} حسب {d}|{m} عبر الزمن|في الصدارة|الأسرع نموًا|انتبه|{a} مقابل {b}|{r} صف|الذروة: {p}، {v}|{m}: {u} بنسبة {x} ({c})، بمقدار {dt}. {w} {n} بـ{dv}.|ارتفاع|انخفاض|أكبر مساهم فيه|أكبر سبب له|نصيب {n} من {m}: {v}.|{n}: {m} من {a} إلى {b} ({c}).|للتحقق: إجمالي {m} = {v}.|وصل {r} من {t} صف فقط.|الرسوم تحتاج اتصالًا بالإنترنت.|الأعلى: {n}، {p}: {v}|الأعلى: {n}، {v}|آخر {n}|إعادة ضبط|مسطّح|اسحب للتدوير · انقر على عمود للتصفية|مقابل {a} – {b}|{r} صف · {a} – {b} · محسوب مباشرة في متصفحك'
:'All|pts|{m} by {d}|{m} over time|Leader|Fastest riser|Watch out|{a} vs {b}|{r} rows|Peak: {p}, {v}|{m} {u} {x} ({c}), {dt} in total. The biggest {w} was {n}, at {dv}.|rose|fell|contributor|drag|{n} brings in {v} of {m}.|{n}: {m} went from {a} to {b} ({c}).|Check: total {m} = {v}.|Only {r} of {t} rows arrived.|Charts need internet to load.|Highest: {n}, {p}: {v}|Highest: {n}, {v}|Last {n}|Reset|Flat|Drag to turn · click a bar to filter|vs {a} – {b}|{r} rows · {a} – {b} · computed live in your browser').split('|'),
TX=Object.assign(Object.fromEntries('all pts by over leader mover watch cmpP pv peak lc up dn cu cd iLead iMove ft cut nochart top rkA win reset flat hint cmpW prov'.split(' ').map((k,i)=>[k,W[i]])),META.t),
tx=(k,o)=>String(TX[k]||'').replace(/\{(\w+)\}/g,(_,x)=>o[x]??''),es=s=>String(s??'').replace(/[&<>"]/g,c=>'&#'+c.charCodeAt()+';'),B=(s,c)=>`<b class=${c}><bdi>${es(s)}</bdi></b>`,
nf=o=>new Intl.NumberFormat(LC,o),nm=v=>v===''||v==null||!isFinite(v=+v)?null:v,
pl=k=>/^\d{4}-\d/.test(k)?new Date(k.slice(0,4),k.slice(5,7)-1,k.slice(8,10)||1).toLocaleDateString(LC,k[8]?{day:'numeric',month:'short'}:{month:'short',year:'numeric'}):k,
isS=m=>/sum|count/.test(m.agg),
ag=(X,m)=>{if(!X?.[0])return null;if(m.agg=='count')return X.length;let s=0,w=0;const q=m.agg=='ratio',t=m.agg=='avg'&&m.w;for(const x of X){const a=x[q?m.num:m.col],b=q?x[m.den]:t?x[m.w]:1;if(a!=null&&b!=null)s+=t?a*b:a,w+=b}return w?m.agg=='sum'?s:s/w:null},
by=(X,f,g=new Map)=>(X.map(r=>{const k=f(r);k!==''&&(g.get(k)||g.set(k,[]).get(k)).push(r)}),g),
RK=(X,k,m)=>[...by(X,r=>r[k])].map(([a,v])=>[a,ag(v,m)]).filter(x=>x[1]!=null).sort((a,b)=>b[1]-a[1]),
CU=()=>S.w&&DT&&PS.slice(-S.w),ri=(p,e)=>RW.filter(r=>Object.keys(S.f).every(k=>k==e||r[k]==S.f[k])&&(!p||p.includes(r._p))),
cm=(n=S.w,L=PS.length)=>PS[1]&&(n&&L>=2*n?{a:PS.slice(-n),b:PS.slice(-2*n,-n),c:tx('cmpW',{a:pl(PS[L-2*n]),b:pl(PS[L-n-1])})}:{a:[Z(PS)],b:[Z(PS,1)],c:tx('cmpP',{a:pl(Z(PS)),b:pl(Z(PS,1))})}),
fs=(v,m={},c)=>{if(v==null||!isFinite(v))return['–',''];if(m.fmt=='pct')return[nf({style:'percent',[F]:m.digits??1}).format(v),''];
const a=ab(v),s=(v<0?'-':'')+nf(c&&a>=(c>1?1e3:1e4)?{notation:'compact',[F]:a<1e6?1:2}:{[F]:m.digits??(a<10?2:a<100?1:0)}).format(a),u=m.unit||'';return/^[$€£¥₹]$/.test(u)?[s.replace(/\d/,d=>u+d),'']:/^[%/]/.test(u)?[s+u,'']:[s,u]},
fx=(v,m,c,p='')=>{const[a,u]=fs(v,m,c);return(R?(p+a).replace(/^\S+/,x=>''+x+''):p+a)+(u&&'\xA0'+u)},
dl=(a,b,m)=>a==null||b==null?null:isS(m)?b?{r:(a-b)/ab(b),t:1}:null:{r:a-b,t:m.fmt=='pct'?2:0},
dv=(d,m)=>d.t==1?fx(ab(d.r),{fmt:'pct'}):d.t?nf({[F]:1}).format(ab(d.r)*100)+' '+TX.pts:fx(ab(d.r),{...m,digits:m.digits??2}),
gd=(d,m)=>!/[1-9]/.test(dv(d,{...m,unit:''}))?'fl':d.r>0!=(m.good=='down')?'up':'dn',
PL=(d,m,g=gd(d,m))=>`<b class=${g}><bdi>${g=='fl'?'•':d.r<0?'▼':'▲'} ${dv(d,m)}</bdi></b>`,
M=()=>MS[S.m]||MS[0],co=k=>P[O0.indexOf(k)%8]||K.mut,
put=(i,o)=>(CH[i]||=(c=>(c.on('click',p=>D0&&/bar/.test(p.seriesType)&&setF(D0.col,p.seriesName)),c))(echarts.init($(i)))).setOption({color:P,textStyle:{fontFamily:K.fb,color:K.mut},tooltip:{trigger:'axis',confine:1,...o.tt},...o},FU||{replaceMerge:['series']}),
yf=m=>({...AX.axisLabel,formatter:v=>v?(R?'':'')+fs(v,m,2)[0]:''}),
prep=()=>{const r=$('DATA').textContent,i=r.indexOf('"rows"'),D=JSON.parse(r.slice(0,i)+'"rows":0}'),L=D.lookups||{},dv=META.derived||[],T=(C=D.cols.map(String)).map((c,i)=>(D.types||[])[i]||(L[c]?'cat':'num'));
DT=C.includes(META.date)?META.date:C[T.indexOf('date')]||'';
RW=(r.slice(i).match(/\[[^[\]]*\]/g)||[]).map(x=>{try{x=JSON.parse(x)}catch(e){return}if(x.length!=C.length)return;const o={};C.map((c,i)=>{const v=L[c]?.[x[i]]??x[i];o[c]=T[i]=='num'&&c!=DT?nm(v):String(v??'')});
dv.map(d=>{const a=o[d.a],b=o[d.b];o[d.col]=a==null||b==null?null:[a+b,a-b,a*b,b?a/b:null]['+-*/'.indexOf(d.op)]??null});o._p=DT?o[DT].slice(0,{year:4,day:10}[META.grain]||7):'';return o}).filter(Boolean);
const NU=C.filter((c,i)=>T[i]=='num'&&c!=DT).concat(dv.map(d=>d.col));PS=[...new Set(RW.map(r=>r._p).filter(Boolean))].sort();
MS=(META.measures||[]).filter(m=>(m.label??=m.col,m.agg??='sum',NU.includes(m.w)||delete m.w,m.agg=='count'||NU.includes(m.agg=='ratio'?m.num:m.col))&&ag(RW,m)!=null);
MS[0]||(MS=[{label:'#',agg:'count'}]);
[D0,D1]=(META.dims||[]).filter(d=>T[C.indexOf(d.col)]=='cat').map(d=>({label:d.col,...d}));[O0,O1]=[D0,D1].map(d=>d?RK(RW,d.col,MS[0]).map(a=>a[0]):[])},
tok=()=>{const c=getComputedStyle(H);'mut:#5B6275 ln:#1E3C8C17 gr:#1E3C8C0F fa:#DCE1EC fb:sans-serif'.split(' ').map(x=>{const[k,d]=x.split(':');K[k]=c.getPropertyValue('--'+k).trim()||d});
P=(H.dataset.theme=='dark'?'F5B544 3DD6C6 8AB8FF FF7A66 B8E07A E9D3A1 F29CC0 7FC8E8':'005EFF FF7A1A 00A99D 8B5CF6 F2A900 EC4D88 1FA2E8 4FB548').split(' ').map(c=>'#'+c);/^#[0-9a-f]{6}$/i.test(META.accent)&&P.unshift(META.accent);H.style.setProperty('--c1',P[0]);
AX={name:'',axisTick:{show:0},axisLine:{lineStyle:{color:K.ln}},splitLine:{lineStyle:{color:K.gr}},axisLabel:{color:K.mut}}},
ctl=()=>{const w=DT&&PS[3]?[0,6,3].filter(n=>n<PS.length):[];Q('bar',(D0?['',...O0.slice(0,8)].map(v=>`<button class=ch data-k="${es(D0.col)}" data-v="${es(v)}" aria-pressed=${(S.f[D0.col]||'')==v}>${v?`<i style=color:${co(v)}>● </i>`+es(v):TX.all}</button>`).join(''):'')
+(D1?`<label class="ch sl">${es(D1.label)}<select data-k="${es(D1.col)}"><option value="">${es(TX.all)}`+O1.map(x=>`<option${S.f[D1.col]==x?' selected':''}>${es(x)}`).join('')+'</select></label>':'')
+(w[1]?'<span class=sg>'+w.map(n=>`<button data-w=${n} aria-pressed=${S.w==n}>${es(n?tx('win',{n}):TX.all)}</button>`).join('')+'</span>':'')+(Object.keys(S.f)[0]||S.w?`<button class=ch id=rs>${es(TX.reset)}</button>`:'')+'<button class=ch id=th>◐</button>')},
st=()=>{const m=M(),c=cm(),k=[D0,D1].find(d=>d&&!S.f[d.col]),L=es(m.label),f=v=>fx(v,m,1),o=[],a=c&&ag(ri(c.a),m),p=c&&ag(ri(c.b),m),d=c&&dl(a,p,m),u=d?.r>0,sm=isS(m),
r=k?RK(ri(CU()),k.col,m):[],t=r.reduce((s,z)=>s+z[1],0),h=sm&&t>0,sc=z=>(m.good=='down'?-1:1)*z.d.r,q=(z,h)=>o.push([h,PL(z.d,m),tx('iMove',{n:B(z.n),m:L,a:B(f(z.b)),b:B(f(z.a)),c:c.c}),z.n]);
let b,v=c&&k?(([A,Y])=>[...new Set([...A.keys(),...Y.keys()])].map(n=>({n,a:A.get(n),b:Y.get(n)})))([c.a,c.b].map(p=>new Map(RK(ri(p),k.col,m)))):[];
d&&sm&&gd(d,m)!='fl'&&v.map(z=>{const x=(z.a||0)-(z.b||0);(u?x>0:x<0)&&!(ab(x)<=ab(b?.[1]))&&(b=[z.n,x])});
Q('ld',b?tx('lc',{u:TX[u?'up':'dn'],w:TX[u?'cu':'cd'],m:L,x:B(dv(d,m),gd(d,m)),c:c.c,n:B(b[0]),dv:B(fx(b[1],m,1,b[1]>0?'+':'')),dt:B(fx(a-p,m,1,a>p?'+':''))}):L+': '+B(f(c?a:ag(ri(CU()),m)))+(d?' '+PL(d,m)+' ('+c.c+')':'')+'.');
if(r[1]){o.push([TX.leader,h?fx(r[0][1]/t,{fmt:'pct'}):f(r[0][1]),h?tx('iLead',{n:B(r[0][0]),v:B(f(r[0][1])),m:L}):B(r[0][0]),r[0][0]]);
v=v.filter(z=>z.d=dl(z.a,z.b,m)).sort((p,q)=>sc(q)-sc(p));v[0]&&sc(v[0])>0&&q(v[0],TX.mover);v[1]&&sc(Z(v))<0&&q(Z(v),TX.watch)}
Q('ins',o.map(z=>`<button class="card ic" data-k="${es(k.col)}" data-v="${es(z[3])}"><small>${es(z[0])}</small><strong>${z[1]}</strong><p>${z[2]}</button>`).join(''))},
kpi=()=>{const X=ri(CU()),c=cm(),g=by(ri(),r=>r._p);Q('kp',MS.slice(0,6).map((m,i)=>{const d=c&&dl(ag(ri(c.a),m),ag(ri(c.b),m),m),v=fs(ag(X,m),m,1),z=PS.map(p=>ag(g.get(p),m)||0),n=z.length,lo=mn(...z),h=mx(...z)-lo||1,
U=k=>(R?n-1-k:k)*160/(n-1),p=z.map((y,k)=>(k?'L':'M')+U(k)+' '+(40-(y-lo)/h*32)).join(''),s=P[i==S.m?0:(i+1)%8];
return`<button class="card k" data-m=${i} aria-pressed=${i==S.m}><small>${es(m.label)}</small><b>${es(v[0])}<i> ${es(v[1])}</i></b><p>${d?PL(d,m)+' '+c.c:''}</p>`+(n>1?`<svg viewBox="0 0 160 46" preserveAspectRatio=none><path d="${p}" fill=none stroke=${s} stroke-width=2.2 vector-effect=non-scaling-stroke /></svg>`:'')}).join(''))},
rnk=()=>{const m=M(),c=D0?.col,r=c?RK(ri(CU(),c),c,m).slice(0,10):[];$('rC').hidden=!r[0];Q('rC',`<h2>${es(tx('by',{m:m.label,d:D0?.label}))}</h2>`+r.map(([k,v])=>`<button class=rb data-k="${es(c)}" data-v="${es(k)}" style="--w:${v/r[0][1]*100}%;--c:${co(k)}99;opacity:${S.f[c]&&S.f[c]!=k?.4:1}">${es(k)}<b>${es(fx(v,m,1))}</b></button>`).join(''))},
hero=()=>{const m=M(),x=D0?.col,sl=S.f[x],me=x?O0.slice(0,8):[m.label],fr=me.slice().reverse(),ps=DT?(CU()||PS).slice(-12):[''],X=ps.map(pl),n=me.length,N=ps.length,
g=by(ri(CU(),x),r=>r._p+'|'+(x?r[x]:m.label)),vl=(p,k)=>ag(g.get(p+'|'+k),m),dm=k=>sl&&sl!=k,e=$('g3'),f=$('g2'),w=e.clientWidth||f.clientWidth,s=w<600,dp=mx(50,mn(130,n*19)),ds=(s?R?210:195:195)+mx(0,e.clientHeight/w-.5)*140;let h=[null];
me.map(k=>ps.map((p,i)=>{const v=vl(p,k);v!=null&&!(v<=h[0])&&(h=[v,k,X[i]])}));
Q('hT',es(tx('by',{m:m.label,d:[D0?.label,DT&&(META.dateLabel||DT)].filter(Boolean).join(' · ')})));Q('hS',h[0]==null?'':tx(DT?'top':'rkA',{n:B(h[1]),p:es(h[2]),v:B(fx(h[0],m,1))}));
Q('mo',['3D',TX.flat].map((t,i)=>`<button data-o=${i} aria-pressed=${S.o==i}>${es(t)}</button>`).join(''));$('mo').hidden=!GL;
Q('lg',x?me.map(k=>`<button data-k="${es(x)}" data-v="${es(k)}" style=opacity:${dm(k)?.45:1}><i style=color:${co(k)}>● </i>${es(k)}</button>`).join(''):'');Q('hn',es(S.o?Z(TX.hint.split(' · ')):TX.hint));
e.hidden=S.o;f.hidden=!S.o;CH[S.o?'g2':'g3']?.resize();
if(S.o)return put('g2',{grid:{left:8,right:8,top:20,bottom:4,containLabel:1},xAxis:{...AX,data:X,inverse:R,axisLabel:{...AX.axisLabel,hideOverlap:1}},yAxis:{...AX,position:R?'right':'left',axisLabel:yf(m)},
series:me.map(k=>({type:'bar',name:k,itemStyle:{color:dm(k)?K.fa:co(k),borderRadius:[3,3,0,0]},data:ps.map(p=>vl(p,k))}))});R&&X.reverse();
put('g3',{tt:{trigger:'item',formatter:p=>es(p.seriesName+' · '+X[p.value[0]])+'<br><b>'+es(fx(p.value[2],m))},
xAxis3D:{...AX,type:'category',data:X,axisLabel:{...AX.axisLabel,fontSize:s?11:12,margin:s?14:10,interval:s?(N>6?2:N>3?1:0):N>8?1:0}},yAxis3D:{...AX,type:'category',data:fr,axisLabel:{show:0},splitLine:{show:0}},zAxis3D:{...AX,splitNumber:s?2:3,axisLabel:{...yf(m),fontSize:s?11:12,margin:s?12:8}},
grid3D:{boxWidth:mx(110,mn(s?150:200,N*18)),boxDepth:dp,boxHeight:s?115:82,axisPointer:{show:0},light:{main:{intensity:1.2,shadow:1},ambient:{intensity:.5}},
viewControl:{center:[s&&R?20:0,s?-28:-40,0],zoomSensitivity:0,panSensitivity:0,animationDurationUpdate:2200,...H0?{alpha:5,beta:R?-62:62,distance:ds+120}:(FU||S2)&&{alpha:s?26:20,beta:R?-30:30,distance:ds}}},
series:fr.map((k,j)=>({type:'bar3D',name:k,shading:'lambert',bevelSize:.35,barSize:[mn(11,130/N),mn(11,dp*.6/n)],itemStyle:{color:dm(k)?K.fa:co(k),opacity:dm(k)?.2:1},animationDurationUpdate:1300,data:ps.map((p,i)=>[R?N-1-i:i,j,H0?0:vl(p,k)||0])}))});
H0&&setTimeout(()=>{S2=1;sf('h',hero);S2=0},350);H0=0},
trend=()=>{if($('tC').hidden=!PS[1])return;const m=M(),g=by(ri(),r=>r._p),y=PS.map(p=>ag(g.get(p),m)),u=CU();let i=0;y.map((v,j)=>v>y[i]&&(i=j));
Q('tT',es(tx('over',{m:m.label})));Q('tS',tx('peak',{p:pl(PS[i]),v:B(fx(y[i],m,1))}));
put('tr',{grid:{left:30,right:30,top:30,bottom:4,containLabel:1},xAxis:{...AX,data:PS.map(pl),inverse:R,boundaryGap:0},yAxis:{...AX,position:R?'right':'left',axisLabel:yf(m)},
series:[{type:'line',smooth:.35,showSymbol:0,lineStyle:{width:3},areaStyle:{opacity:.15},data:y,markArea:{silent:1,itemStyle:{color:P[0]+'1A'},data:u?[[{xAxis:pl(u[0])},{xAxis:pl(Z(u))}]]:[]}}]})},
sf=(k,f)=>{try{f()}catch(e){console.error(e);k&&($(k+'C').hidden=1)}},
draw=(f,n)=>{FU=f;tok();[ctl,st,kpi,rnk].map(g=>sf('',g));n||!window.echarts||(sf('h',hero),sf('t',trend));FU=0},
setF=(k,v)=>{v&&S.f[k]!=v?S.f[k]=v:delete S.f[k];draw()};
let C,DT,RW,MS,D0,D1,PS,O0,O1,GL,FU,H0=1,S2,P,AX,K={},CH={},S={m:0,f:{},w:0,o:0};
onclick=e=>{const t=e.target.closest('button'),d=t?.dataset||{};d.k?setF(d.k,d.v):d.m?(S.m=+d.m,draw()):d.w?(S.w=+d.w,draw()):d.o?(S.o=+d.o,sf('h',hero)):t?.id=='rs'?(S.f={},S.w=0,draw()):t?.id=='th'&&(H.dataset.theme=H.dataset.theme=='dark'?'light':'dark',draw(1))};
onchange=e=>e.target.dataset.k&&setF(e.target.dataset.k,e.target.value);
onresize=()=>Object.values(CH).map(c=>c.resize());
addEventListener('DOMContentLoaded',async()=>{const nt=t=>$('mn').insertAdjacentHTML('afterbegin',`<p class=note>${es(t)}`);try{prep()}catch(e){return nt('DATA: '+e.message)}
const n=RW.length.toLocaleString(LC),s=MS.find(isS)||MS[0];document.title=$('ti').textContent=META.title||'Dashboard';
Q('ey',(META.source?B(META.source):'')+es(PS[0]?tx('prov',{r:n,a:pl(PS[0]),b:pl(Z(PS))}):tx('pv',{r:n})));
Q('ft',tx('ft',{m:es(s.label),v:B(fx(ag(RW,s),{...s,digits:s.digits??3}))})+[META.note].concat(META.notes).filter(Boolean).map(x=>'<br>· '+es(x)).join(''));
META.rows>RW.length&&nt(tx('cut',{r:RW.length,t:META.rows}));draw(1,1);
try{GL=window['echarts-gl']&&document.createElement('canvas').getContext('webgl')}catch(e){}GL||(S.o=1);
if(!window.echarts)return $('hC').hidden=$('tC').hidden=1,nt(TX.nochart);
await document.fonts.ready;draw(1);$('g3').addEventListener('wheel',e=>e.stopPropagation(),{capture:1,passive:1})})
</script>
<script type="application/json" id="DATA">
PUT_DATA_JSON_HERE
</script>
</html>
```
إذا النتيجة ما طلعت مثل المثال
- إذا ردّ عليك بشرح فقط: قل له «أرجع ملف dashboard.html كاملاً، مع تعبئة META وDATA من ملفي، بدون حذف القالب أو أي صف من البيانات».
- إذا انقطع الرد: اطلب الملف كمرفق قابل للتنزيل أو استخدم أداة تسمح بإخراج ملف كامل؛ لا تجمع أجزاء ناقصة وتعتبرها النتيجة النهائية.
- إذا الرسوم ما ظهرت: اتصل بالإنترنت، وتأكد أن المتصفح ما حجب مكتبات الرسوم. جرّب خيار العرض المسطّح في الداشبورد إذا جهازك ما يدعم الرسم الثلاثي.
- إذا الأرقام مختلفة: ابدأ بالإجمالي وعدد الصفوف، واطلب توضيح الأعمدة والصفوف اللي استخدمها. لا تعتمد على الشكل وحده.
دليل عملي من @arimi.ai. تحميل PDF فيه الخطوات والصور؛ البرومبت الكامل والقالب موجودان في TXT وعلى هذه الصفحة. الصفحة ثابتة لهذا الموضوع وتُحدّث عند الحاجة.